Introduction
This is the first in a series of two blog posts on monitoring the energy (primarily electricity) consumption and production in my (and my parents’) home. I’ve been fascinated by topics around energy informatics, renewable energy, smart grids, etc. for years. Plus, I’m quite passionate about monitoring various kinds of things, gathering data over time and then plotting nerdy statistics. This includes technical aspects like monitoring server utilization, but also extends to my personal life, including nutrition tracking or gathering facts about my body health with my Fitbit.
One of the things that I was most curious about though, was to get insights about my personal energy consumption - and possibly even optimize it based on these. At latest when I got my own balcony power plant a few years ago, this whole project started to take off.
Effectively, I had built two different setups for electricity monitoring - one for myself and another one for my parents’ home. In this article, I’ll cover the latter, while my own, personal setup (which is a little more sophisticated ;-)) will be covered in the next blog post.
Goal
My goal was to track power consumption and production as precisely as possible to eventually be able to gather (a) “real-time” insights about when there is overcapacity and (b) analyze historical data to potentially find interesting patterns, etc.
Initial Situation
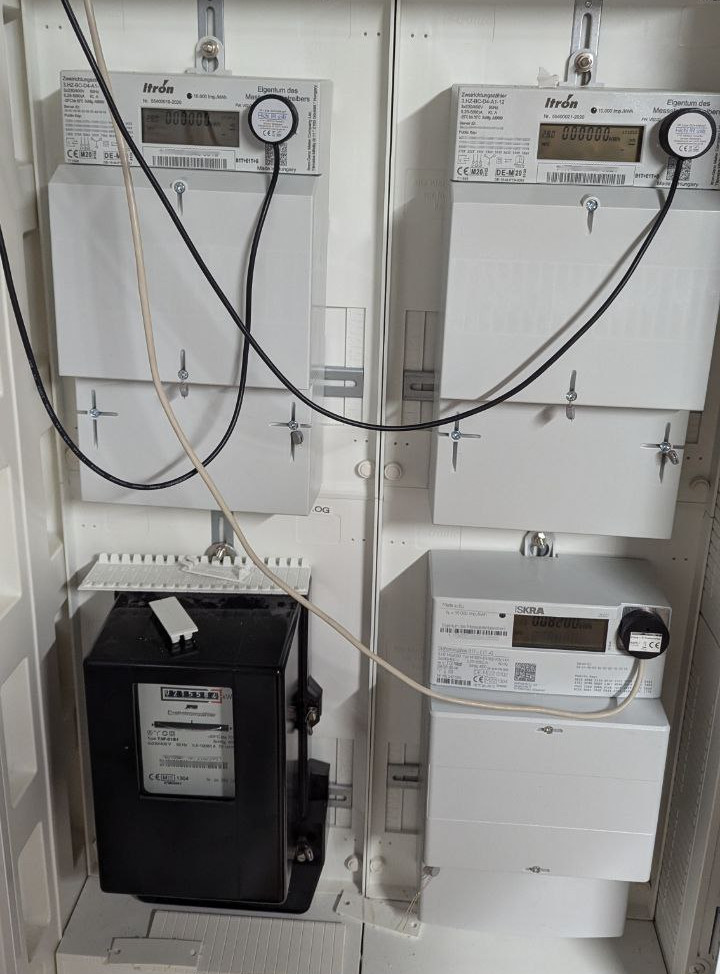
First step in this whole endeavor was to take stock of the given situation. The circumstances were as follows. In my parents’ home, we have three digital Itron OpenWay® 3.HZ power meters and a fourth old, analogue one. The digital meters feature an infrared, optical interface for very basic metrics. More precisely, they provide data for these OBIS identifiers:
1.8.0- Total energy (Wh) inbound (total)1.8.1- Total energy (Wh) inbound (tariff 1)1.8.2- Total energy (Wh) inbound (tariff 2)2.8.0- Total energy (Wh) outbound16.7.0- Current net power (W)
That is, the meters support two separate tariffs as well as to distinguish between consumption and production. For the analogue meter, there - obviously - was no straightforward way to automatically read it (people have built systems involving a camera and some OCR, but that’s maybe for another time). I reached out to the grid operator to ask if they were willing to install smart meter gateways in our house - which probably would have made things a lot easier - but unfortunately they declined my request.
On the production side, my parents’ house has a photovoltaic installation with around 5 kWp on its roof.
Excursus: Smart Meter Gateways
Short side node: smart meter gateways (SMG) come with a ton of benefits and are considered a crucial part of the energy transformation and a requirement to keep electricity grids robust and stable in the future, with increasing percentage of renewable source on the grid. Among others, they enable for smart grid management and demand-side management for higher flexibility. While many countries in the EU already have a high percentage of SMG (e.g. Sweden and Spain have 100 %), Germany still lacks behind with a rollout percentage of only 1 %.
.png)
(Source: https://www.gridx.ai/knowledge/smart-meter)
Monitoring Setup
Power meter reading
Given the above circumstances, the obvious approach to gather data about power consumption and production was to deploy infrared (IR) readers to the power meters. After some research, I chose to buy three of these optical IR readers with USB interface. Alternatively, they also come with only a serial interface, but for my use case, having a built-in USB controller came in quite handy. More details on the readers to be found on this wiki.
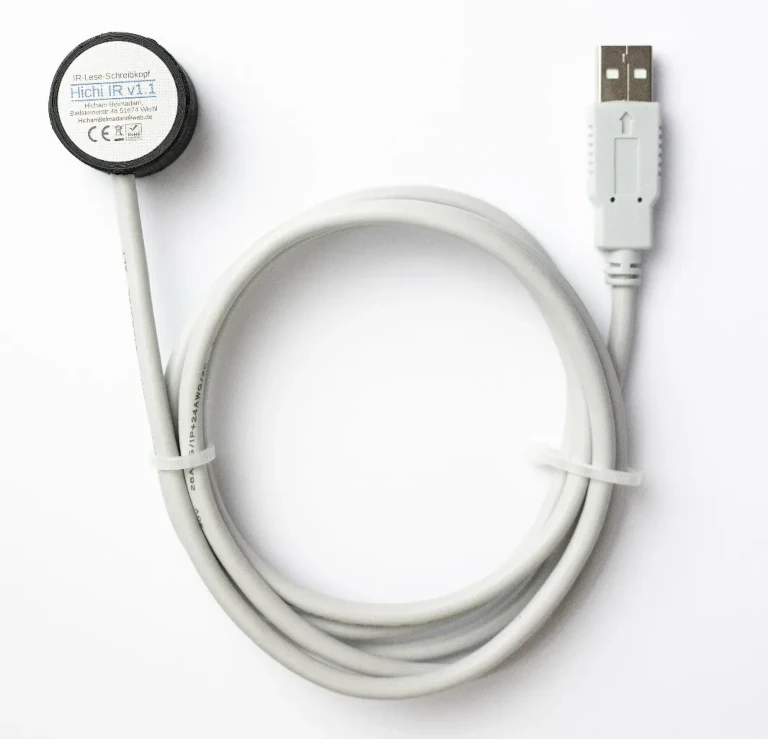
(Source: https://www.ebay.de/itm/315022714074)
When connected to a computer, data can be read from these using a very simple, binary serial protocol called the Smart Meter Language. I started out with a self-written Python script to parse the data, but then decided to switch for an existing implementation for better robustness. There is libsmal for C, sml_parser as a C++ client, jSML for Java, or SmartMeter.py. I opted for the script referenced in this blog post, though, because I thought it would best fit my needs. It not only includes an SML parser, but also a higher-level Python class for reading smart meters and even an MQTT interface - perfect!
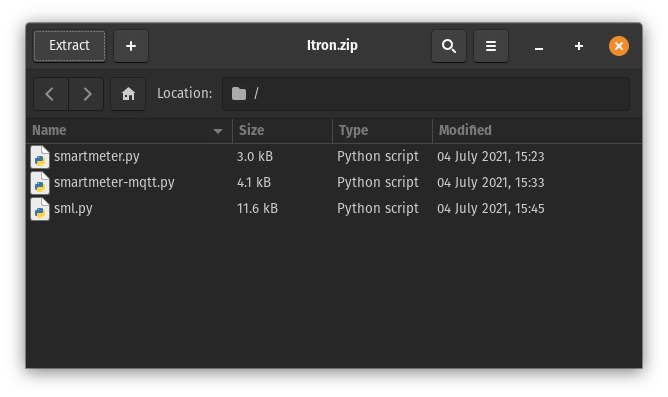
I fixed a few minor bugs in that script and adapted it to my specific needs here and there. Eventually, I was able to simple run it from the command-line (or as a SystemD service unit), only passing it the path to a usb serial interface file descriptor (/dev/ttyUSB0 to /dev/ttyUSB2 on in my case - so one instance of the script for each of the three readers).
Side story: USB drivers on ARMv7 Synology DSM
Probably the biggest struggle in this whole project was related to the fact that I wanted to connect the readers to a (fairly old) Synology NAS, that’s anyways already located right next to the breaker panel. The NAS runs on some ancient Linux kernel version and has a Marvell ARMv7 CPU. Getting the Hitchi IR readers’ USB controllers be recognized by the OS was not as straightforward as I thought. Eventually, I ended up installing a SynoCommunity package (synokernel-usbserial, thanks a lot to the authors!) that contains USB serial drivers (CP210x) for the controller used in the reader heads. Details described here and here. In addition, I put udev rules in place to always map the same reader to the same file descriptor.
Data transfer and ingest
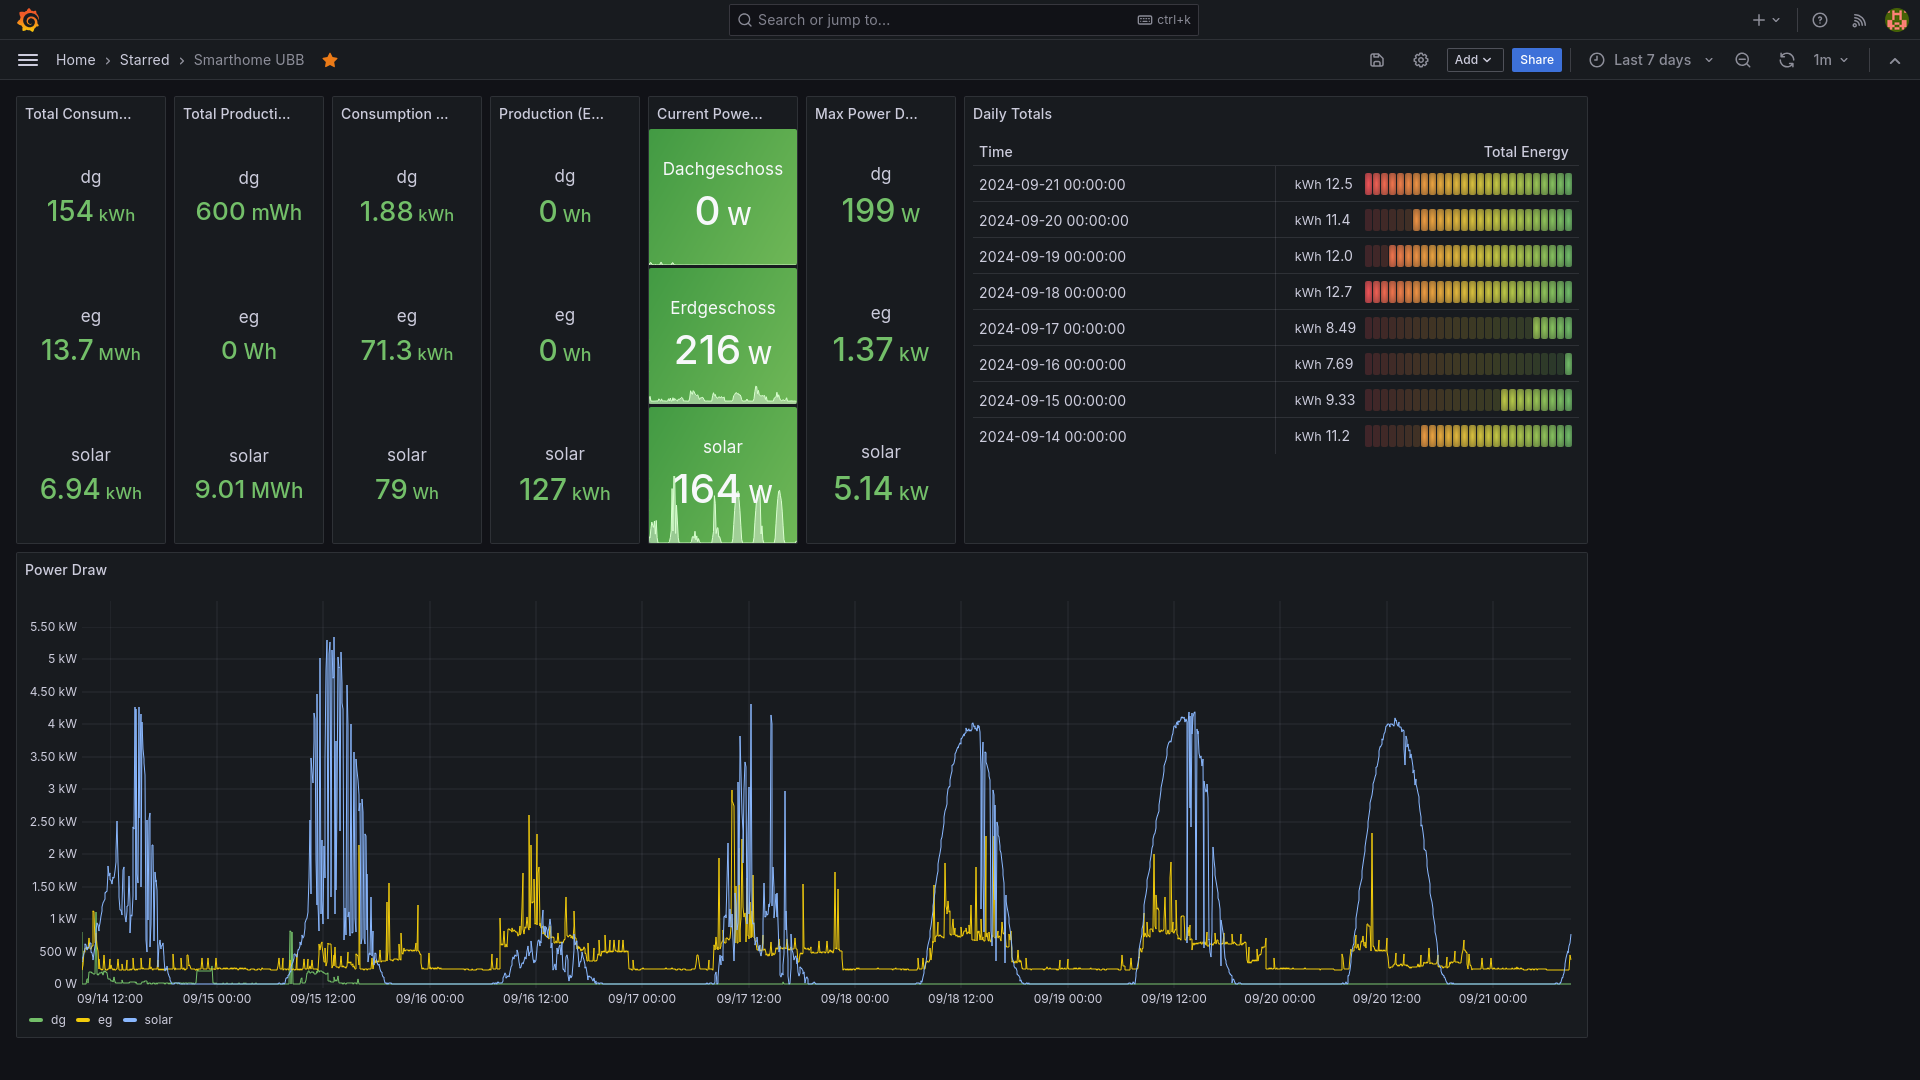
After I got the readings per power meter in Python, the rest of the setup was straightforward. I used the (modified) script provided above to send readings to an MQTT topic provided by the Mosquitto running on my cloud VPS. From there, a simple Node-RED flow picks them up and ingests them into VictoriaMetrics (a Prometheus-compatible - but much better for many reasons! - time-series database) via the InfluxDB line protocol.

The Grafana server - that I’m already using for many other monitoring use cases - connects to it and plots some nice-looking graphs (see screenshot above)- awesome! 🙌
Overall Architecture
The overall setup schematically looks like this.

Alternative Setups
When I planned out the above setup, I considered a couple different alternatives.
One option was to employ Volkszaehler, which is an amazing community-mainted project specifically for energy monitoring and integrations / drivers for a lot of different power- and water meter devices and its own frontend / visualization UI.
Another option was to flash ESP32 microcontrollers with Tasmota, which also inherently comes with support SML and pre-defined configs for many difference devices. There’s even a variant of the Hitchi IR reader that already comes with a Tasmota-flashed microcontroller and WiFi on it.
The third architecture I considered, inspired by this post on serial over Ethernet, was similar to this one, but would not read and parse the SML readings “on the edge”, but instead proxy the raw serial data over MQTT (e.g. using 2mqtt or OpenMQTTGateway) and then processing them on the server side.
Ultimately, I found my setup described in this article to be the best trade-off between (a) utilizing systems that I already had (Prometheus, Grafana, Mosquitto, the NAS, …), (b) keeping the setup rather simple and (c) cost-effective.
Outlook
Part 2 of this mini-series will cover the monitoring setup employed in my own apartment. It’s a lot more comprehensive, technically challenging, but also even more insightful. Stay tuned!
Comments