Introduction
This is the second article in my mini-series on smart home energy monitoring. In the previous post I described my setup for monitoring electricity consumption in my parents’ home using various different technologies. In this post, I’ll cover my own, personal setup, which gets me even more excited to share my insights on!
Again, I’m fascinated by everything related to energy informatics, renewable energy technologies, smart grid systems, etc. and I’m excited to contribute my own tiny share to the energy transformation. As someone who loves nerdy statistics, one fun step towards that is to start tracking my energy (primarily electricity) consumption and production and - potentially - optimize my behavior based on the data gathered. For more on this motivation, please also refer to my last post.
This project already started two years ago, when I bought a balcony power plant for my apartment. At this point, at latest, I got totally hooked by monitoring my power demand and supply as precisely as I could.
Initial Setup
Like with the previous setup, the very first step was to take stock of what’s given.
Balcony power plant
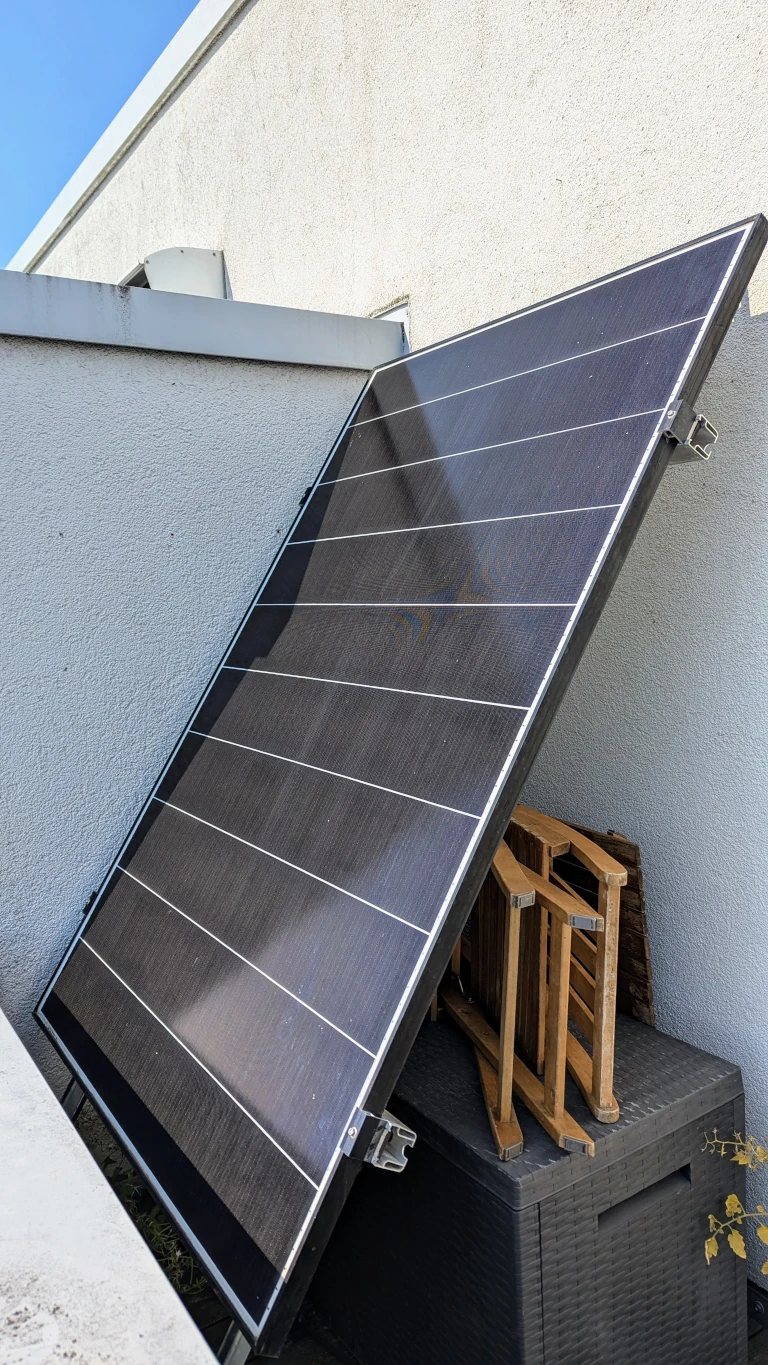
One crucial component in all of this is the solar panel that I had put up on my balcony. It’s a Hyundai HiE-S400VG 400 Wp monochrystalline PERC module, connected to a 330 W inverter. I bought both parts used for 450 € about three years ago and additionally built the mounting together with a friend from parts we got at the hardware store. Prices for photovoltaic modules have dropped dramatically since then, and I’d probably get a better module and inverter in new condition for less than 200 € today. Although it’s a bit of a nuisance that I paid more than double of today’s price, I generally find it super cool to see those panels becoming so much more affordable, encouraging more people to produce their own electricity on a decentralized way.
3-phase Modbus power meter
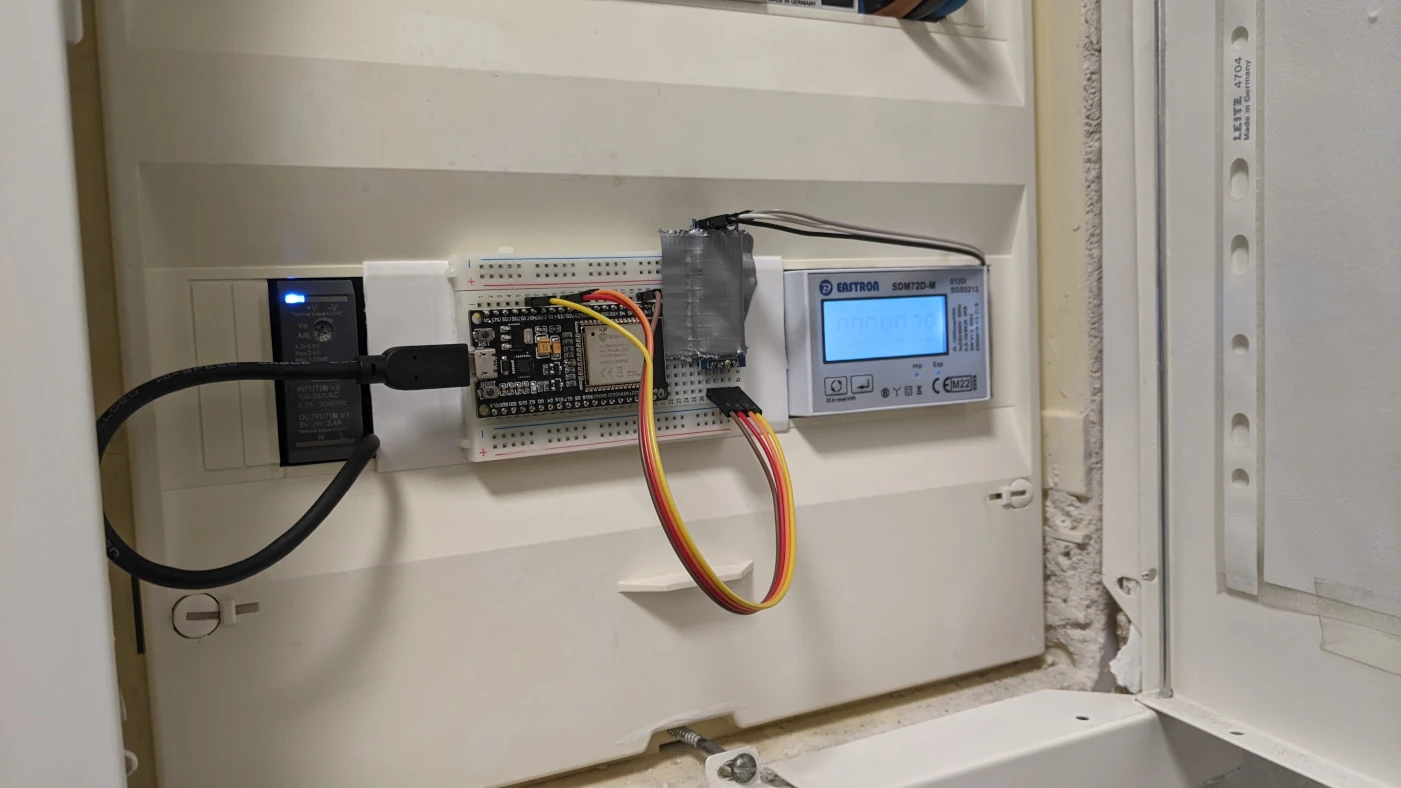
Second piece is the power meter. Because I live in an apartment building, the breaker panel is located in the basement three floors below my flat, without WiFi connection and only accessible to the janitor. A setup utilizing its infrared interface - as I did at my parents’ (see previous post) - was not an option. I first thought of deploying WiFi or ZigBee power meters like the Shelly PM Mini to every wall socket. But I came up with an even better solution: I decided to get a Eastron SDM72D three-phase DIN rail power meter for less than 100 € and had it assembled into my apartment-local breaker panel. It comes with a digital Modbus interface and fans out more than 50 different readings per second - perfect!
Monitoring Setup
Reading the Modbus interface with Tasmota
To read out the meter, I decided to purchase an ESP32 microcontroller alongside a DIN rail-mounted 5V power supply. I flashed the ESP with Tasmota firmware and compiled the Smart Meter Interface into it. It comes with support for various different smart metering protocols, including SML, S-0 and Modbus, as well as pre-defined configs for various devices. Unfortunately, mine wasn’t supported out of the box. However, I could draw a lot of inspiration from already existing configs and by observing the raw data sent on the Modbus interface, my friend and I managed to write a SDM72D driver for Tasmota SMI in the course of an evening. We eventually upstreamed it as pull request #1065. Here is a non-comprehensive list of meter readings provided (only depicted for phase 1):
voltage_phase1(V)current_phase1(A)power_phase1(W)power_apparent_phase1(VA)power_reactive_phase1(VA)power_factor_phase1(%)voltage_avg(V)current_avg(A)power_total(W)frequency(Hz)energy_imported(Wh)energy_exported(Wh)energy_total(Wh)energy_net(Wh)power_import(W)power_export(W)- …
More than enough! (I had to google what reactive- and apparent power even are).
Reading solar production with a Shelly
Having all these values is already pretty good. Even better is the fact that the meter is able to distinguish between import and export. However, it’s still not entirely sufficient, because at this point, I couldn’t precisely decompose net power consumption into actual consumption and production, yet. Normally, I would assume that all power produced by my solar panel is tracked as energy_exported, while everything I’m consuming is reflected in energy_imported. However, the energy that I immediately consume the moment it’s being produced won’t be reflected whatsoever, as in won’t even be fed into the grid in the first place and thus not “pass through” the meter (very non-technically speaking…). That is, if I consume precisely, say, 300 watts, while the photovoltaic panel produces the exact same amount (connected to the same phase), the meter would show 0 for all power_* readings.
To account for this, I installed another, wall-socket mounted power meter - a Shelly Plus 2PM to the socket that the panel is plugged in to. Check.
Data transfer and ingest
Gathering the sensor readings was the hardest part. The rest was quite straightforward. Thanks to Tasomota’s MQTTS support, I set up the microcontroller to send the readings directly to the Mosquitto running on my cloud VPS. The Shelly firmware was configured to do the same. From there on, the setup is pretty much identical to what was described in the previous post. A simple Node-RED flow picks them up and ingests them into VictoriaMetrics (again, a better, Prometheus-compatible time-series database) via the InfluxDB line protocol. Eventually, the data are visualized and plotted in Grafana 🙌.
Dashboard
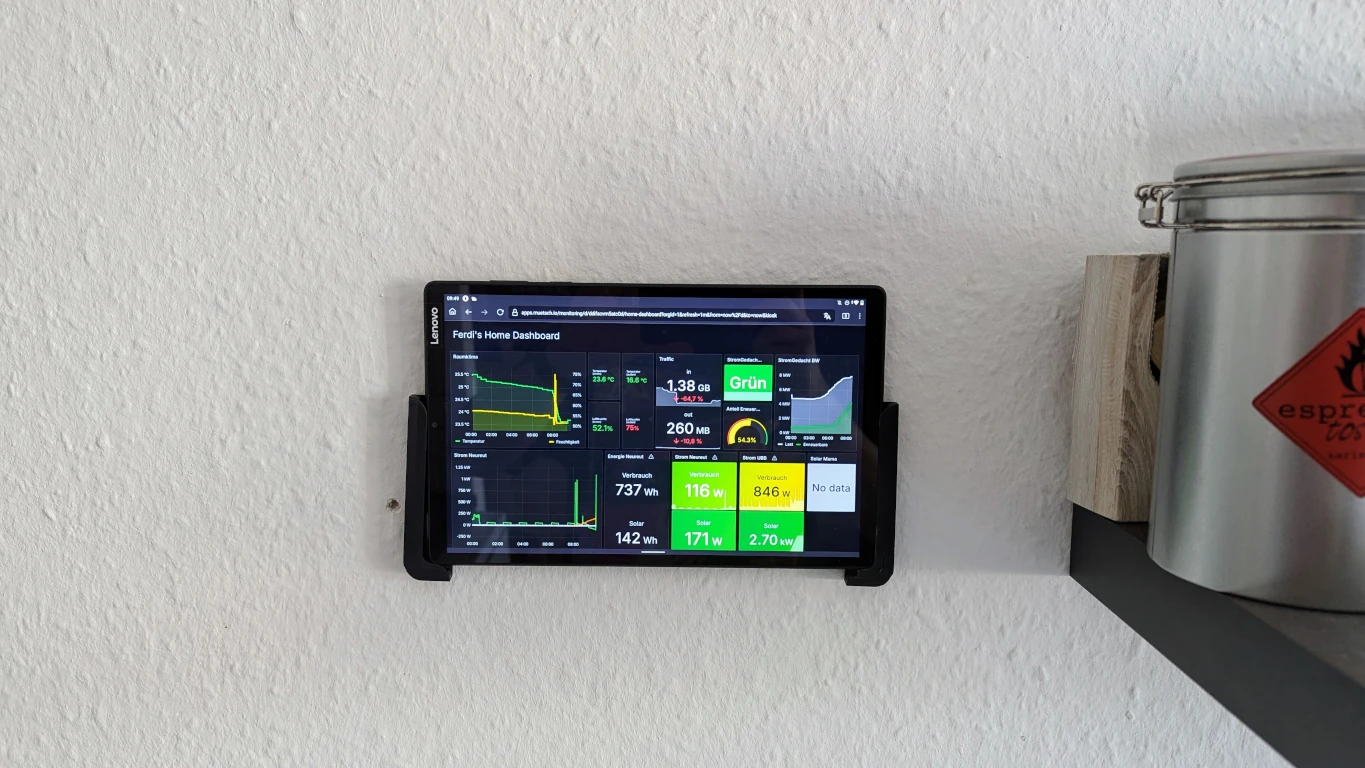
Because I still had a cheap Android tablet lying around, I decided to have a friend 3D-print a wall mounting for it and set it up as a smart home dashboard in my apartment. Primarily, it prints my current power consumption and -production and today’s net energy consumption. In addition, it talks to the Stromgedacht API to fetch the current grid situation (from red to super green) and current renewables percentage on the grid. This helps guide decisions such as when to best do my laundry to (a) be friendly to the grid and (b) minimize CO2 emissions. Moreover, the dashboard also shows room- and outside temperature and humidity as well as my inbound and outbound internet traffic of the day (using fritz-exporter).
Overall Architecture
This is what the whole setup looks like from an architecture perspective.

Conclusion
This article ends my mini-series on energy monitoring in a smart home context. I had built these setups a while ago already but only now found time to do a writeup. I had a whole lot of fun implementing all of this and am still excited to look at the stats every day 🤓. But not only are these data super interesting, they actually helped me change my behavior to an extent . I got a better feeling for my personal power consumption and got to understand the bigger picture of the whole electricity grid in greater detail. I actually switched to doing laundry or mealprep when there is overcapacity on the grid and try to avoid optional loads when the electricity mix only comprises 25 % or so of renewables (btw., definitely check out ElectricityMaps in this context!). Of course, this is only an infinitesimally small contribution and doesn’t actually do any change. In the context of climate change, as Gabriel Baunach (recommended read!) puts it, it’s much more effective to increase your handprint than reduce your footprint. But still - I enjoy these little optimizations. And I might do another, much less technical blog post on topics like these. Until then, I hope this article to encourage more people to keep an eye on their power consumption. Thanks for reading!
Comments