Monitoring Caddy requests with Prometheus and Grafana

Introduction

Caddy is cool web server and I really like it for how simple and easy it is to use. I’m using it both as a static file server and a reverse proxy for years now (including for service like Wakapi). You could even use it as an API gateway, featuring authentication / authorization, load balancing, etc.

Problem

Who needs Common Log Format anyway?

From version 2.4 to 2.5, the authors removed support for logging requests in Common Log Format (CLF) (here is why). I didn’t really like that decision because, first, what about semantic versioning?! 🤔 And, second, while I see the downsides of CLF, it’s probably still the most widely used format for web server logs and simply dropping that feels a bit drastic. Anyways, after upgrading Caddy, my monitoring broke. I was using grok_exporter (Caddy istself doesn’t support per-host metrics, yet) to read Caddy’s access logs and provide them to Prometheus, which, in turn, was called by Grafana to plot cool-looking dashboard with stats about my web apps.

Solution

Switching to JSON logging

I decided to switch to logging in JSON format instead, because JSON is commonly understood and well supported by all kinds of programs and libraries. My vhosts now look like this:

1
2
3
4
5
6
7
8
9
10
11
12
13
14
# /etc/caddy/Caddyfile

wakapi.dev {
# ...

reverse_proxy http://[::1]:3000

log {
output /var/log/caddy/wakapi.access.log
format json
}

# ...
}

Parsing and exporting logs to Prometheus

This also meant that I had to find a new way of parsing an exporting the logs. Technically, I could have continued using the _grok_exporter_, but writing a regex pattern to extract fields from JSON lines seemed to much of a hassle to me. Instead, I found json-log-exporter, which does exactly what I needed. It takes a list of files in JSON Lines format and exports certain fields as Prometheus metrics, depending on your config / mapping. I came up with this config for the tool:

1
2
3
4
5
6
7
8
9
10
11
12
13
14
15
16
17
18
19
20
21
22
23
24
25
26
27
28
29
30
31
32
33
34
35
36
37
38
39
40
41
# /etc/json-log-exporter/json_log_exporter.yml

namespace: jsonlog
exports:
- name: default
path: /metrics
log_groups:
- name: caddy
subsystem: caddy
files:
- /var/log/caddy/wakapi.log
- /var/log/caddy/muetschio.log
# more
labels:
host: "{{.request.host}}"
proto: "{{.request.proto}}"
method: "{{.request.method}}"
response: "{{.status}}"
metrics:
- name: count_total
type: counter
export_to: default
- name: bytes_total
type: counter
value: "{{.size}}"
export_to: default
- name: duration_total
type: histogram
buckets:
- 0.001
- 0.01
- 0.05
- 0.1
- 0.5
- 1
- 5
- 10
- 30
- 60
value: "{{.duration}}"
export_to: default

SystemD service

I created a simple SystemD service unit to run the exporter in the background:

1
2
3
4
5
6
7
8
9
10
11
12
13
14
15
16
17
# /etc/systemd/system/json-log-exporter.service

[Unit]
Description=JSON Log Exporter

[Service]
Type=simple
User=json_log_exporter
WorkingDirectory=/opt/json-log-exporter
ExecStart=/opt/json-log-exporter/json-log-exporter -config-file /etc/json-log-exporter/json_log_exporter.yml -web.listen-address 127.0.0.1:9321
Restart=on-failure
RestartSec=90
StartLimitInterval=400
StartLimitBurst=3

[Install]
WantedBy=multi-user.target

Testing it

Running this provides an endpoint at http://localhost:9321/metrics, that exports the metrics defined above. Here’s an example:

1
2
3
4
5
6
7
8
9
10
11
12
13
14
15
jsonlog_caddy_bytes_total{host="wakapi.dev",method="GET",proto="HTTP/2.0",response="200"} 1.6983983e+07#

jsonlog_caddy_count_total{host="wakapi.dev",method="GET",proto="HTTP/2.0",response="200"} 26202

jsonlog_caddy_duration_total_bucket{host="wakapi.dev",method="GET",proto="HTTP/2.0",response="200",le="0.001"} 81
jsonlog_caddy_duration_total_bucket{host="wakapi.dev",method="GET",proto="HTTP/2.0",response="200",le="0.01"} 8343
jsonlog_caddy_duration_total_bucket{host="wakapi.dev",method="GET",proto="HTTP/2.0",response="200",le="0.05"} 24542
jsonlog_caddy_duration_total_bucket{host="wakapi.dev",method="GET",proto="HTTP/2.0",response="200",le="0.1"} 25977
jsonlog_caddy_duration_total_bucket{host="wakapi.dev",method="GET",proto="HTTP/2.0",response="200",le="0.5"} 26190
jsonlog_caddy_duration_total_bucket{host="wakapi.dev",method="GET",proto="HTTP/2.0",response="200",le="1"} 26195
jsonlog_caddy_duration_total_bucket{host="wakapi.dev",method="GET",proto="HTTP/2.0",response="200",le="5"} 26196
jsonlog_caddy_duration_total_bucket{host="wakapi.dev",method="GET",proto="HTTP/2.0",response="200",le="10"} 26198
jsonlog_caddy_duration_total_bucket{host="wakapi.dev",method="GET",proto="HTTP/2.0",response="200",le="30"} 26202
jsonlog_caddy_duration_total_bucket{host="wakapi.dev",method="GET",proto="HTTP/2.0",response="200",le="60"} 26202
jsonlog_caddy_duration_total_bucket{host="wakapi.dev",method="GET",proto="HTTP/2.0",response="200",le="+Inf"} 26202

Grafana visualization

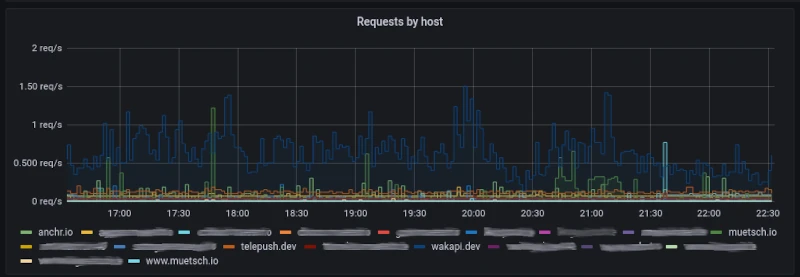
Using the following query in Grafana, you can plot cool charts showing your requests per seconds across all your sites.

1
sum(irate(jsonlog_caddy_count_total[5m])) by (host)