
Prometheus Alerting
Prometheus is among the most popular tools for server monitoring. It aggregates metrics from potentially countless different sources (provided through so called exporters), stores them in its own time series database and allows them to be queried, e.g. by visualization tools like Grafana. One central aspect of monitoring, besides visualization of data, is alerting. A very common use case for Prometheus is to watch a server’s runtime performance metrics, e.g. its CPU utilization or hard drive usage, and be notified when things go unusual, for instance, when the hard drive is close to running out of free space. Or you might want to use the blackbox_exporter to watch an HTTP or TCP endpoint for being available and get immediate alerts as it goes down. For this, Prometheus integrates with Alertmanager, their own little daemon process whose sole purpose is to send out alert notifications triggered by Prometheus queries.
Alertmanager supports for different receivers, among the most popular of which arguably is email. But there are many more, including the generic webhook one, which is quite powerful.
Receiving alerts in Telegram
E-Mail is well and good, but also feels a bit “heavy-weight” and outdated. You might rather want to receive your server monitoring alerts through your favorite messenger, for instance, Telegram. In the following, you’ll learn how to do so with minimal effort by using Telepush. As an example, we are going to set up Prometheus to watch a locally running web service and send a Telegram messages once it’s unavailable.
Prerequisites
I assume you have an up and running setup of Prometheus, Alertmanager and Blackbox Exporter (only required for this example) already.
Obtain a token from Telepush
You will receive notifications through Telepush’s bot. From a technical perspective, an alert takes this way:
1 | Prometheus --> Alertmanager --> Telepush API --> Telegram |
That is, Alertmanager sends all alerts to Telepush’s web API, which then forwards it to your Telegram chat with the bot. To instruct Telepush where to route which messages, you initially have to get in contact with Telepush’s Telegram bot and obtain a token.
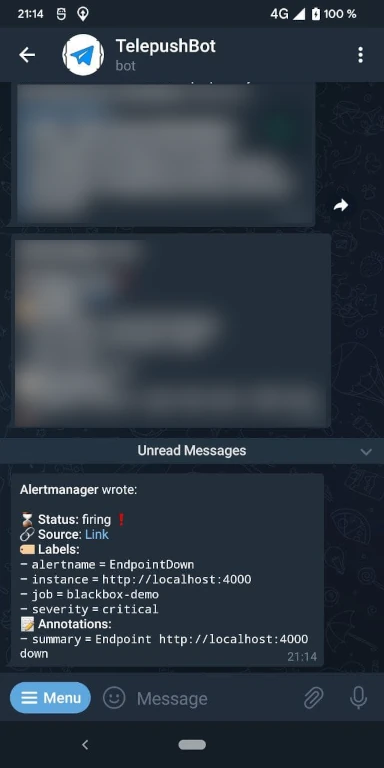
Open a new chat with TelepushBot (Telepush was formerly called MiddlemanBot) and simply send /start. You’ll receive a token. Keep it for the next step.
Configure Alertmanager
Let’s continue with the interesting part and configure Alertmanager to send alerts via Telepush. In my case, the Alertmanager’s config file lives at /opt/alertmanager/alertmanager.yml.
1 | # alertmanager.yml |
Then, apply the configuration through a reload:
1 | curl -X POST http://localhost:9093/-/reload |
🎉 You’re done! That’s already it.
No more is needed to hook up Alertmanager with Telepush. For the sake of completeness, though, let’s continue with the config requires to connect Prometheus and Alertmanager in the first place and to set up blackbox monitoring.
Excursus: Configure Prometheus
Below is the configuration to instruct Prometheus where to find the Alertmanager and a job to monitor a webpage at http://localhost:4000 for being up and returning a 2xx HTTP response code.
1 | # prometheus.yml |
Additionally, we need to configure the notification template for alerts triggered by Blackbox Exporter.
1 | # custom_alerts.yml |
Excursus: Configure Blackbox Exporter
Another short snippet is required in the blackbox exporter’s config file to make available the http_2xx module used above.
1 | # blackbox.yml |
Testing it
To set the set up, we simply reload Prometheus (just like reloading the Alertmanager above) and wait for a minute.
Comments